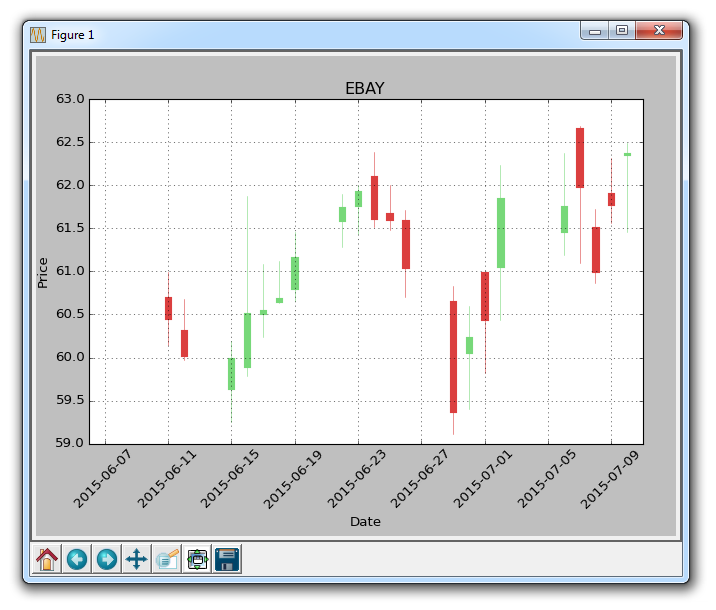
我正在尝试在用户单击有效点时使用 matplotlib 交互绘制 OHLC 图。数据存储为
形式的 pandas 数据框index PX_BID PX_ASK PX_LAST PX_OPEN PX_HIGH PX_LOW
2016-07-01 1.1136 1.1137 1.1136 1.1106 1.1169 1.1072
2016-07-04 1.1154 1.1155 1.1154 1.1143 1.1160 1.1098
2016-07-05 1.1076 1.1077 1.1076 1.1154 1.1186 1.1062
2016-07-06 1.1100 1.1101 1.1100 1.1076 1.1112 1.1029
2016-07-07 1.1062 1.1063 1.1063 1.1100 1.1107 1.1053
我正在用 matplotlib 的烛台函数绘制它:
candlestick2_ohlc(ax1, df['PX_OPEN'],df['PX_HIGH'],df['PX_LOW'],df['PX_LAST'],width=1)
绘制时它看起来像这样:
我希望控制台打印出点击点的值、日期以及它是开盘价、最高价、最低价还是收盘价。到目前为止,我有类似的东西:
fig, ax1 = plt.subplots()

ax1.set_title('click on points', picker=True)
ax1.set_ylabel('ylabel', picker=True, bbox=dict(facecolor='red'))
line = candlestick2_ohlc(ax1, df['PX_OPEN'],df['PX_HIGH'],df['PX_LOW'],df['PX_LAST'],width=0.4)

def onpick1(event):
    if isinstance(event.artist, (lineCollection, barCollection)):
        thisline = event.artist
        xdata = thisline.get_xdata()
        ydata = thisline.get_ydata()
        ind = event.ind
        #points = tuple(zip(xdata[ind], ydata[ind]))
        #print('onpick points:', points)
        print( 'X='+str(np.take(xdata, ind)[0]) ) # Print X point
        print( 'Y='+str(np.take(ydata, ind)[0]) ) # Print Y point

fig.canvas.mpl_connect('pick_event', onpick1)
plt.show()
然而,这段代码在运行和点击点时不会打印任何内容。当我查看交互式 matplotlib 图的示例时,它们往往在 plot 函数中有一个参数,例如:
line, = ax.plot(rand(100), 'o', picker=5)
但是,candlestick2_ohlc 不采用“选择器”arg。关于如何解决这个问题的任何提示?
谢谢
请您参考如下方法:
您需要设置 set_picker(True) 以启用选择事件或以 float 形式给出以点为单位的公差(参见 http://matplotlib.org/api/artist_api.html#matplotlib.artist.Artist.set_picker )。
所以在你的情况下 ax1.set_picker(True) 如果你想在鼠标事件结束时触发 pick 事件 ax1。
您可以在烛台图表的元素上启用选择事件。我阅读了文档和 candlestick2_ohlc返回两个对象的元组:LineCollection 和 PolyCollection。所以你可以命名这些对象并将它们的选择器设置为 true
(lines,polys) = candlestick2_ohlc(ax1, ...)
lines.set_picker(True) # collection of lines in the candlestick chart
polys.set_picker(True) # collection of polygons in the candlestick chart
事件的索引 ind = event.ind[0] 将告诉您集合中的哪个元素包含鼠标事件(event.ind 返回一个列表索引,因为鼠标事件可能涉及多个项目)。
在烛条上触发拾取事件后,您可以打印原始数据框中的数据。
这是一些工作代码
import matplotlib.pyplot as plt
from matplotlib.collections import LineCollection, PolyCollection
from matplotlib.text import Text
from matplotlib.finance import candlestick2_ohlc
import numpy as np
import pandas as pd

np.random.seed(0)
dates = pd.date_range('20160101',periods=7)
df = pd.DataFrame(np.reshape(1+np.random.random_sample(42)*0.1,(7,6)),index=dates,columns=["PX_BID","PX_ASK","PX_LAST","PX_OPEN","PX_HIGH","PX_LOW"])
df['PX_HIGH']+=.1
df['PX_LOW']-=.1

fig, ax1 = plt.subplots()

ax1.set_title('click on points', picker=20)
ax1.set_ylabel('ylabel', picker=20, bbox=dict(facecolor='red'))

(lines,polys) = candlestick2_ohlc(ax1, df['PX_OPEN'],df['PX_HIGH'],df['PX_LOW'],df['PX_LAST'],width=0.4)
lines.set_picker(True)
polys.set_picker(True)

def onpick1(event):
    if isinstance(event.artist, (Text)):
        text = event.artist
        print 'You clicked on the title ("%s")' % text.get_text()
    elif isinstance(event.artist, (LineCollection, PolyCollection)):
        thisline = event.artist
        mouseevent = event.mouseevent
        ind = event.ind[0]
        print 'You clicked on item %d' % ind
        print 'Day: ' + df.index[ind].normalize().to_datetime().strftime('%Y-%m-%d')
        for p in ['PX_OPEN','PX_OPEN','PX_HIGH','PX_LOW']:
            print p + ':' + str(df[p][ind])
        print('x=%d, y=%d, xdata=%f, ydata=%f' %
          ( mouseevent.x, mouseevent.y, mouseevent.xdata, mouseevent.ydata))


fig.canvas.mpl_connect('pick_event', onpick1)
plt.show()