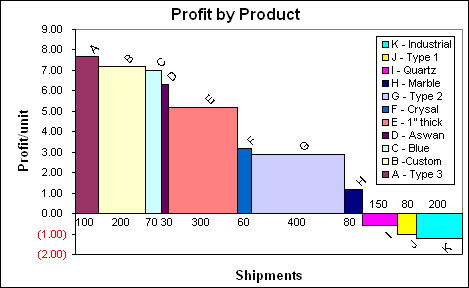
我正在使用 matplotlib 制作级联图(this style 中的内容)。我想让我所有不同宽度的条形相互齐平,但我希望底部的刻度从 1 定期增加到 7,独立于条形。然而,目前,它看起来像这样:
到目前为止,这是我得到的:
python

import numpy as np
import matplotlib.pyplot as plt
from matplotlib.ticker import MultipleLocator, FormatStrFormatter


n_groups = 6
name=['North America','Russia','Central & South America','China','Africa','India']

joules = [33.3, 21.8, 4.22, 9.04, 1.86, 2.14]
popn=[346,143,396,1347,1072,1241]

fig, ax = plt.subplots()

index = np.arange(n_groups)
bar_width = [0.346,.143,.396,1.34,1.07,1.24]

opacity = 0.4

rects1 = plt.bar(index+bar_width, joules, bar_width,
                 alpha=opacity,
                 color='b',
                 label='Countries')

def autolabel(rects):
    # attach some text labels
    for ii,rect in enumerate(rects):
        height = rect.get_height()
        ax.text(rect.get_x()+rect.get_width()/2., 1.05*height, '%s'%(name[ii]),
                ha='center', va='bottom')

plt.xlabel('Population (millions)')
plt.ylabel('Joules/Capita (ten billions)')
plt.title('TPEC, World, 2012')
plt.xticks(1, ('1', '2', '3', '4', '5','6')
autolabel(rects1)

plt.tight_layout()
plt.show()
到目前为止,我尝试过的所有调整栏间距的变体都导致了类似的问题。有任何想法吗?
请您参考如下方法:
目前的问题是您的 index 是一个规则的序列,因此每个条形图的左侧边缘都以规则的间隔定位。您希望 index 成为条形 x 值的总和,以便每个条形的左侧边缘与前一个条形的右侧边缘对齐。
您可以使用 np.cumsum() 执行此操作:
...
index = np.cumsum(bar_width)
...
现在 index 将从 bar_width[0] 开始,因此您需要将条形的左侧边缘设置为 index - bar_width:
rects1 = plt.bar(index-bar_width, ...)
结果:
当然,您会想要调整轴限制和标签位置以使其看起来更漂亮。