感谢您的帮助!
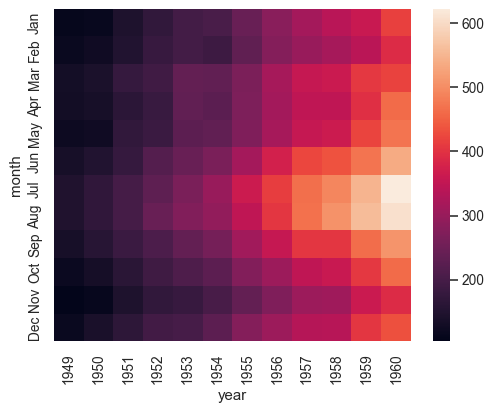
我想用 python 从数据 df 生成一个热图。
(我在我的项目中使用了 pandas、seaborn、numpy 和 matplotlib)
数据框 df 看起来像:
index | a | b | c | year | month
0     |   |   |   | 2013 |   1
1     |   |   |   | 2015 |   4
2     |   |   |   | 2016 |   10
3     |   |   |   | 2017 |   1
在数据集中,每一行都是一张票。
数据集很大(51 列和 100k+ 行),
所以 a、b、c 只是为了显示一些随机列。 (对于月份 => 1 = 一月,2= 二月...)
对于热图:
x-axis = year,
y-axis = month,
值:在热图中,我希望两个轴之间的值是行数,其中在该年和月提供了一张票。
我想象的结果应该类似于 seaborn 文档中的结果: https://seaborn.pydata.org/_images/seaborn-heatmap-4.png
我是编码新手,尝试了很多我在 Internet 上找到的随机方法,但无法使其正常工作。
谢谢你的帮助!
请您参考如下方法:
应该这样做(使用生成的数据):
import pandas as pd
import seaborn as sns
import random

y = [random.randint(2013,2017) for n in range(2000)]
m = [random.randint(1,12) for n in range(2000)]


df = pd.DataFrame([y,m]).T
df.columns=['y','m']
df['count'] = 1
df2 = df.groupby(['y','m'], as_index=False).count()
df_p = pd.pivot_table(df2,'count','m','y')


sns.heatmap(df_p)
您可能不需要 count 列,但我添加它是因为我需要一个额外的列来让 groupby 工作。