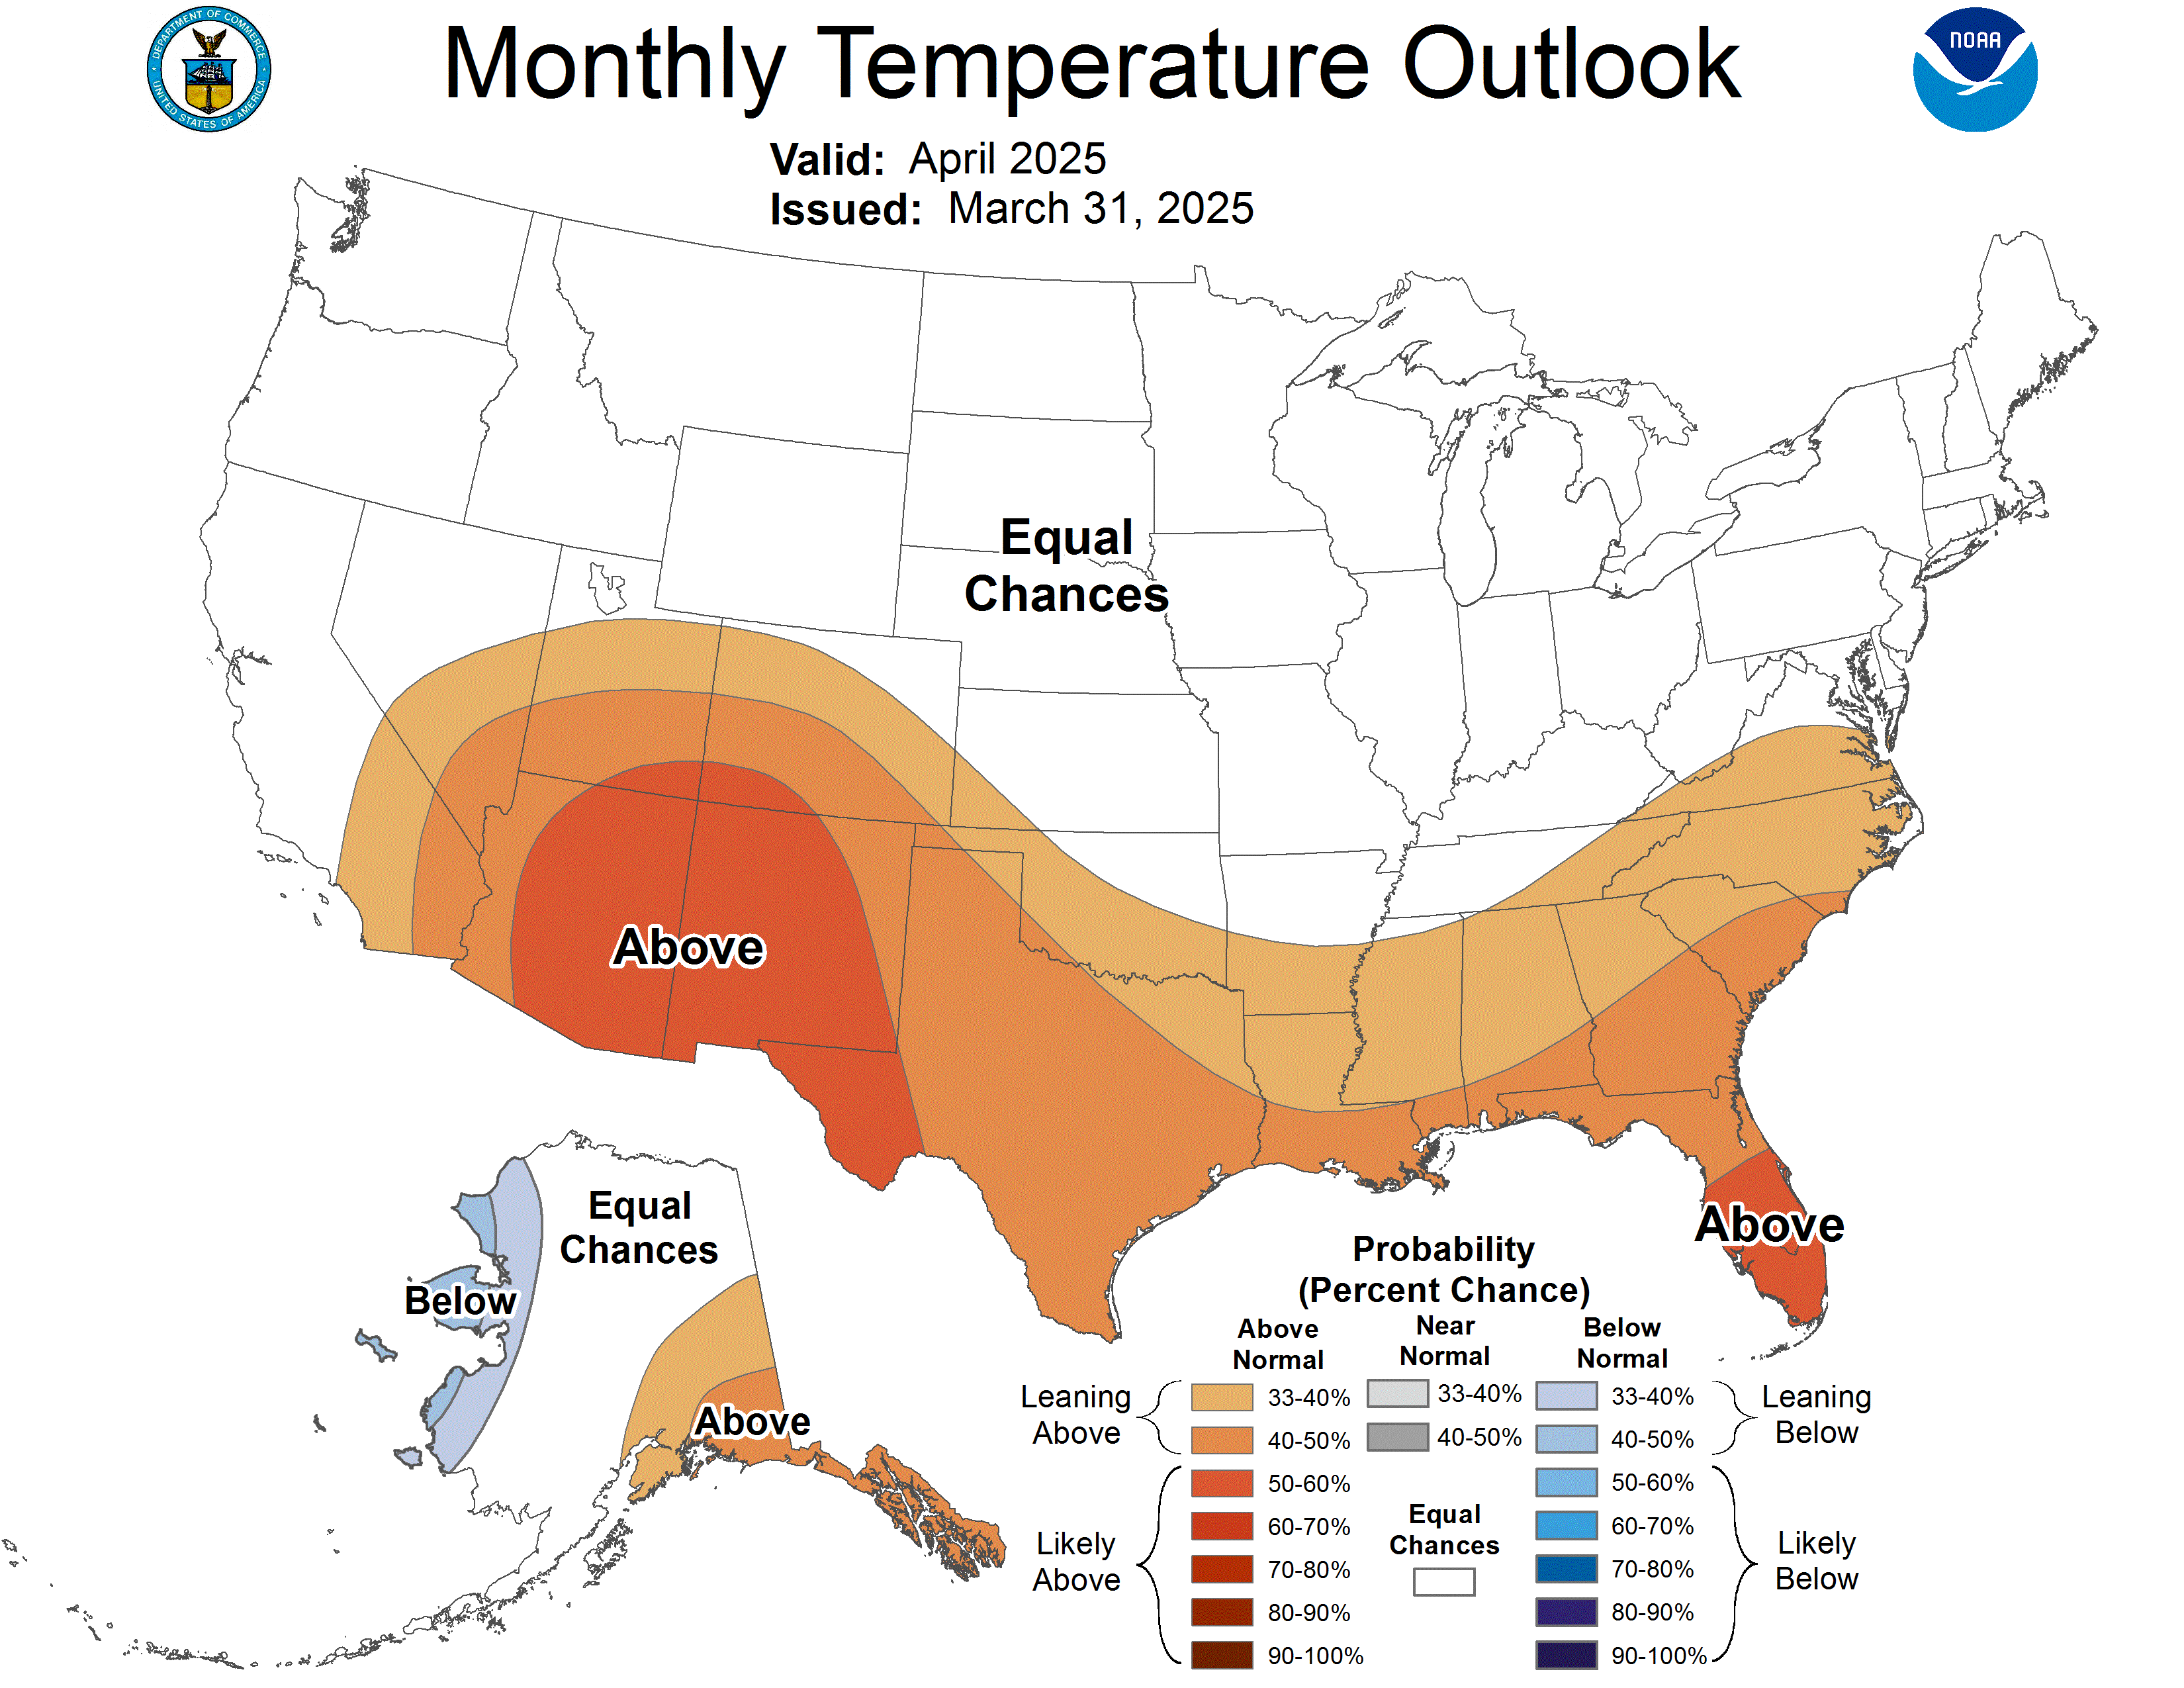
我对 Python 比较陌生。我希望从三个颜色条创建一个填充轮廓图,如下所示:http://www.cpc.ncep.noaa.gov/products/predictions/30day/off15_temp.gif
我已经能够创建三个颜色条,每个颜色条的长度都与图的一侧相同,并将它们分别放置在左侧、底部和右侧。我的问题有两个:
如何调整颜色条的大小使其小于绘图的一侧(我已经能够缩小宽度,而不是颜色条的长度。此外,我只能缩小颜色条与情节的一侧一样长)?
如何放置多个颜色条,使它们并排出现在图的底部(我还没有看到在图的一侧有多个颜色条的单一解决方案) ?
下面是我的部分代码:
import matplotlib.pyplot as plt
import numpy as np

#import data
#lon and lat are arrays representing longitude and latitude respectively
#prob_above, prob_normal and prob_below are arrays representing the probability of above average, normal and below average temperature or precipitation occurring

clevs = np.arange(40,110,10) #percent
cs_above = plt.contourf(lon, lat, prob_above, clevs)
cs_normal = plt.contourf(lon, lat, prob_normal, clevs)
cs_below = plt.contourf(lon, lat, prob_below, clevs)

cbar_above = plt.colorbar(cs_above, location = 'left')
cbar_normal = plt.colorbar(cs_normal, location = 'bottom')
cbar_below = plt.colorbar(cs_below, location = 'right')
请您参考如下方法:
颜色条是在轴内创建的。 要完全控制颜色条所在的位置,您可以在相应位置创建一个轴,并使用颜色条的 cax 参数指定要使用哪些轴来显示颜色条。
要创建有用的坐标轴,GridSpec 可能会有所帮助,其中主图跨越多个网格单元并且单元格高度的比率非常不对称。
import numpy as np
import matplotlib.pyplot as plt
from matplotlib.gridspec import GridSpec

x,y1,y2,y3 = np.random.rand(4,15)

gs = GridSpec(2,3, height_ratios=[15,1])

fig = plt.figure()
# Axes for plot
ax = fig.add_subplot(gs[0,:])
# three colorbar axes
cax1 = fig.add_subplot(gs[1,0])
cax2 = fig.add_subplot(gs[1,1])
cax3 = fig.add_subplot(gs[1,2])

# plot
sc1 = ax.scatter(x, y1, c=y1, cmap="viridis")
sc2 = ax.scatter(x, y2, c=y2, cmap="RdYlGn")
sc3 = ax.scatter(x, y3, c=y3, cmap="copper")

# colorbars
fig.colorbar(sc1, cax=cax1, orientation="horizontal")
fig.colorbar(sc2, cax=cax2, orientation="horizontal")
fig.colorbar(sc3, cax=cax3, orientation="horizontal")

plt.show()